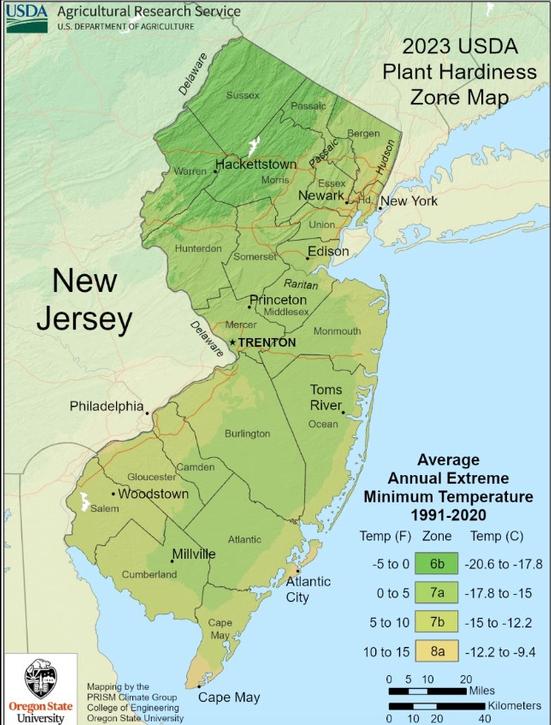
USDA Hardiness Zone Map
The zones in our catalog are based on research performed and published by the USDA, resulting in their “USDA Hardiness Zone Map”. We list the zones for the coldest temperature which the specific plant will tolerate in normal Northeastern winter conditions. For more information click here

USDA Hardiness Zone Map
